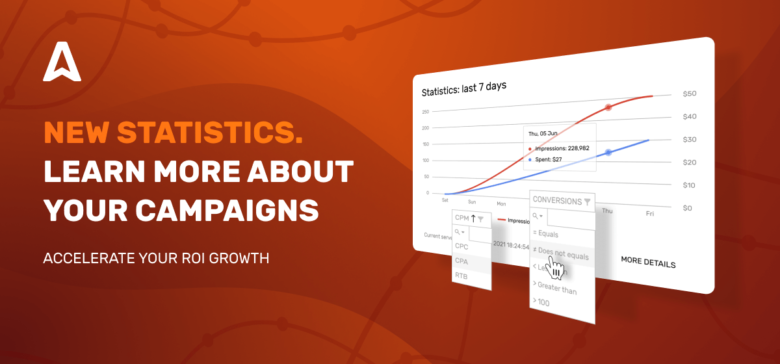
Adsterra Statistics Updates. Find Your Campaigns' Strengths and Flaws in Seconds
Halfway you make with targeting, and halfway you make with getting your results right. Today you will learn a couple of totally new tools that will help you assess campaigns’ results faster and optimize bids on time. We have rolled out the long-awaited update of the Adsterra Statistics for advertisers: advanced filtering, extra grouping, and view configuration. Be sure not to leave the tips below without test-driving them. The theory doesn’t make profits, you know.
Adsterra Statistics for advertisers: what's under the hood
Before we dive into the updates, we need to take a snapshot of the advertisers’ stats and list the metrics you see here.
General grouping and filtering
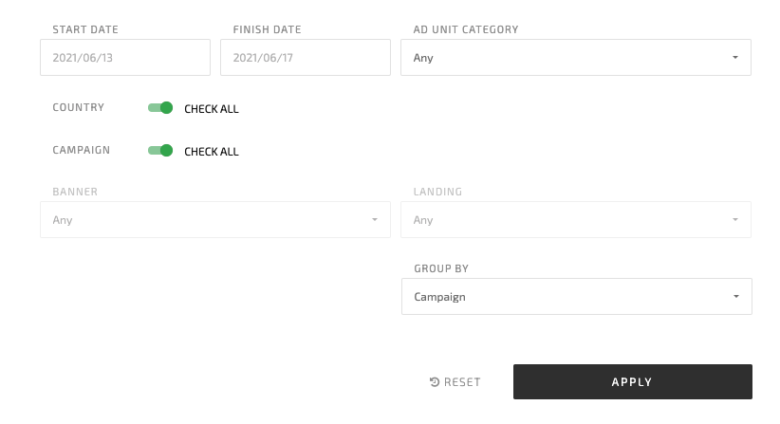
When you log in to your account and hit the Statistics tab, first, we offer you a toolbar with general filters. This toolbar and its GROUP BY filter particularly will affect how the table with metrics is displayed.
Here you set up the parameters of data slices you need to check and how you will get your metrics later. You can select the timeframe for your data snapshot, pick several campaigns, landings, etc.
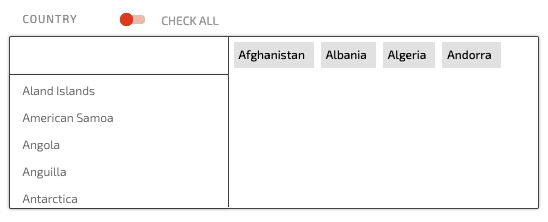
For example, you can filter data by country/countries to make sure all your campaigns that target this country run well, and you don’t need to re-estimate bids.
In the GROUP BY field, you can apply one of the following parameters:
- Campaign
- Banner
- Landing
- Placement
- Country
- Date
- Ad Unit Category
Using the GROUP BY filter for PLACEMENT is always helpful when you’re creating traffic blacklists and whitelists. All data will represent the traffic performance on each placement. It’ll be much easier to cherry-pick the best traffic sources.
Core metrics of the Adsterra statistics for advertisers
Right after the main toolbar comes the table with all Adsterra metrics grouped by the parameters from above.

In the table, you can check all the following metrics:
- DATE,
- MPRESSIONS,
- CLICKS,
- CTR (click-through ratio),
- CONVERSIONS
- I2C (impression-to-conversion rate),
- CPM (cost per thousand impressions),
- SPENT (money spent depending on the pricing type).
The core metrics remain the same, and the first column depends on the GROUP BY general filter we talked about earlier. If you have not used any general filters, the default setting for grouping your data will be DATE. It’ll be the first column in the table.
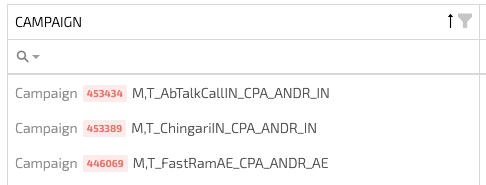
If you grouped data, say, by Campaign, then your table’s first column will be CAMPAIGN. You will also see an additional field CAMPAIGN ID.
Adsterra Statistics updates: perfect data clarity delivered
Recently, we’ve updated the stats so that you can enjoy its loading speed and some new tools that will help you find the strengths and flaws of your campaigns in seconds. Let’s get down to them.
Use advanced filtering to promptly discover winner and laggard campaigns
The most powerful update is additional filtering for every metric in the Stats table. You can dig through any flaw of any campaign as well as discover truly diamond performers.

How advanced filter work
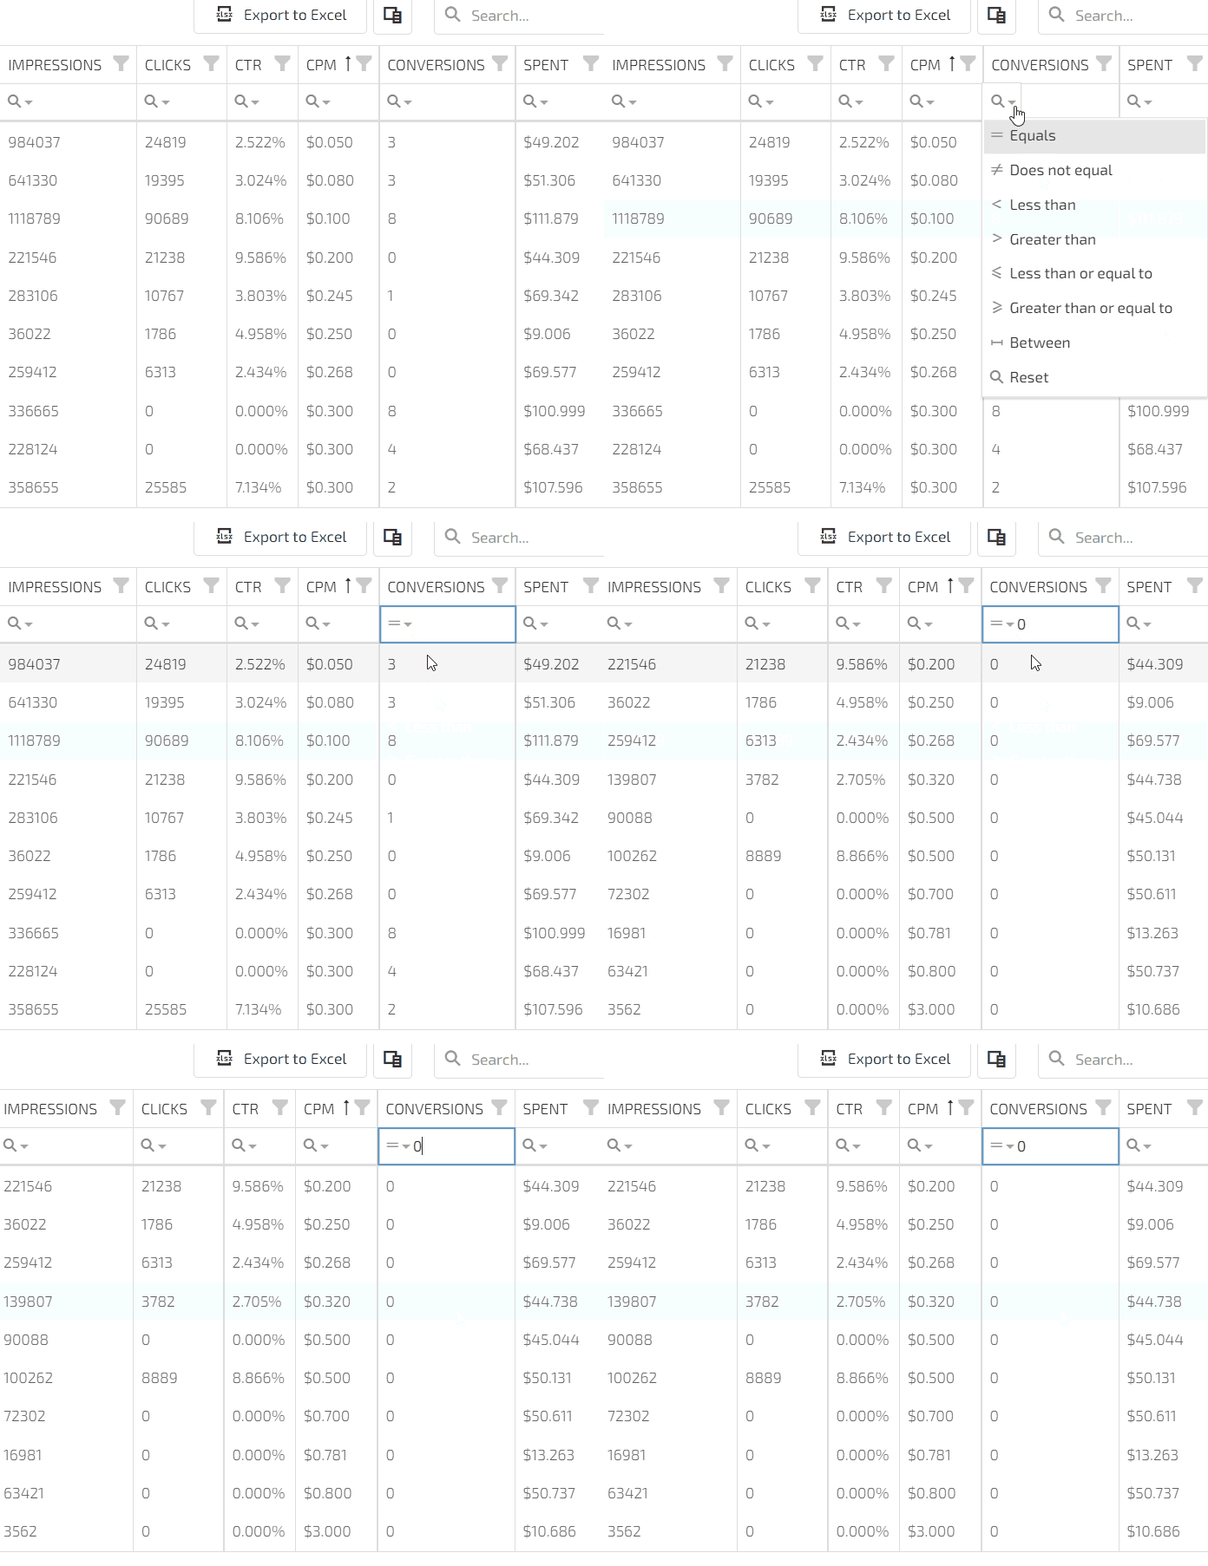
Supposing you need to find zero-conversion campaigns very quickly to optimize them or even stop. You move to the CONVERSIONS metric and select a regular expression “equals = 0”.
In the same way, you can find the most and the least expensive campaigns by using regular expressions “less than=” or “greater than=” in the CPM or SPENT columns.
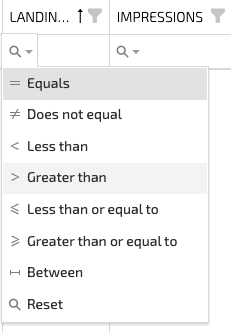
Regular expressions vary for text and numeric data
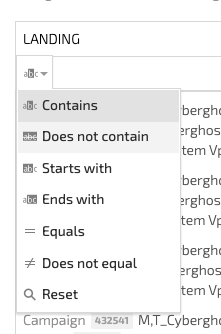
Another way to use advanced filters is to group campaigns by the pricing model. Just type in “CPM/CPA/CPC/RTB” in the CAMPAIGN column to see their performance.
Group data by key metrics to discover extra insights
If you have several campaigns and tons of data, try this tool. It allows you to create temporary groups of filters. Simply drag the header of the columns you want to become your filters to the upper part of the table (you see the tooltip here).
For example, you can group campaigns by the CPM rate to compare your spending or find the best-performing campaign among those with equal expenditures.

Hide unnecessary data and export customized reports
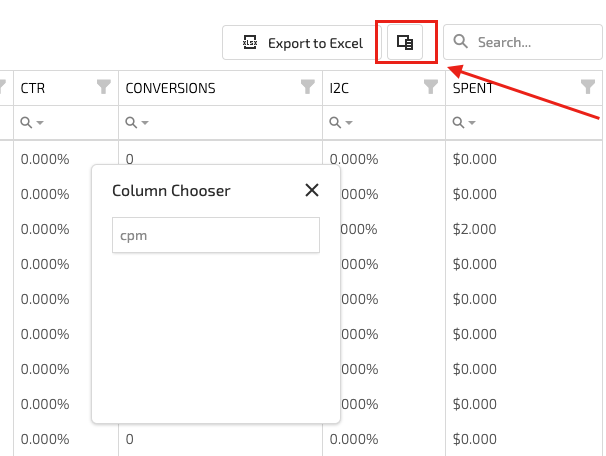
Neat stats is what you need most of all when analyzing performance. Now it is possible to remove the unused columns from the current view. Click the Column Chooser icon and move the header of the unnecessary to the newly opened field. By clicking Column Chooser once again, you will be able to restore the hidden column.
EXTRA: stats customization
Though it’s not about performance, it is still vital for usability. Your Adsterra statistics for advertisers are now more UX-friendly.
- Change the columns’ width. Simply drag the border of any column until you get the required width.
- Change the columns’ order. Pick and drag the header of a column anywhere within the table.
- Use global search to find any data within the table.
- Fix the columns the way you do working with Excel or Spreadsheets.
Enhance your campaigns performance with these powerful tools
4 use cases that prove you will love these updated statistics
1. Exclude traffic sources before they eat your money
This is vital if you run seasonal campaigns for Sports or iGaming verticals. Streaming platforms usually send you loads of traffic during major events. This traffic may be your target, but sometimes these are tons of occasional impressions without any clicks. They keep on streaming, draining your budgets.
With CONVERSION filters, you can easily detect those traffic peaks and see if you get enough conversions. If not, copy the placements IDs and create a greylist with lower bids. It is worth launching a separate campaign with only these placements.
2. Meet the KPIs for conversions
When running an E-commerce, PIN Submit, Finance campaign, you often need to meet specific requirements for conversions to break even, at least. With advanced filtering, you can promptly check the number of conversions within any campaign, landing, ad unit, or other parameters. Use regular expressions to find numeric or text data.
3. Find the best-converting creatives
When you have just started running several similar campaigns where settings are pretty much alike, CTRs will be the first marker of success. You can either make Adsterra stats to show you the best CTRs or group all your data by this parameter.
4. Implement both CPM and CPA strategy with ease
CPM campaigns demand a long-run game while the CPA-based ones are quick to bring results. It has been pretty cumbersome to separate them. But now, you will simply enter “CPA” or “CPM” in the CAMPAIGN column and get all the data you need.
As recommended in our previous guides, Finance and iGaming campaigns are better to run with the CPM pricing. They have a long conversion flow; it means it takes a longer time for users to make a decision. So it would be better if you kept to cautious spending tactics here. You will need to distribute the budgets wisely so that all of those impressions could convert into submits. If you choose the CPA model, you might spend all your budgets overnight without conversions.
Conclusion
These were the most helpful and rewarding updates of the Adsterra Statistics for both advertisers and affiliates aiming at buying traffic. You can tweak all of the updated settings now. And what’s also essential — you can ask us anything about Stats, because reading tutorials can be a bit dreary compared to getting a handy short answer from an expert manager 😉
